Evaluating drought risk through vulnerability assessments
Vulnerability assessments are a key step in hazard mitigation planning because they can identify underlying structural weaknesses (i.e., vulnerabilities) in our social, environmental, and economic systems – these are what we experience as hazard impacts. However, understanding vulnerability tends to be more complicated for drought than for other natural disasters because drought, unlike hurricanes or wildfires, is a slow-moving, insidious phenomenon that can extend for weeks, months, and even years. Since we often do not realize the full range of impacts until the drought is over, it can be very difficult to untangle all the different underlying weaknesses that caused the impacts. Still, it’s worth conducting a vulnerability assessment because it helps us identify proactive measures we can implement to lessen the impacts of future drought – before the next one occurs.
Here's an example: Pasture production is limited during drought, so ranchers often need to purchase supplemental hay to feed their cattle. The added cost of buying and transporting the supplemental hay is a drought impact. However, identifying the underlying vulnerability that is causing the impact can be difficult. For instance, the rancher may not qualify for a certain relief program, or maybe the pasture soil needs more organic matter to increase the amount of moisture it can hold. In this case, it would be worthwhile to evaluate agricultural relief programs to make sure they’re reaching producers in need. It would also make sense to consider incentive programs for producers to integrate more conservation practices, like cover crops, into their operations. Vulnerabilities should be considered using a variety of lenses – social, ecologic, and economic – because drought affects our lives in many complex ways.
Drought Vulnerability in Montana
To assess Montana’s drought vulnerability, we focused on five different water-use sectors:
- Agriculture
- Conservation and land management
- Energy and industry
- Planning and community development
- Recreation and tourism
We used two approaches: one calculated vulnerability scores using existing, publicly-available data about Montana, while the other relied on insights offered by stakeholders during one-on-one interviews and through survey responses. The first approach used indicator data specific to each sector (e.g., crop sales for agriculture; population density for planning and community development) to compute a vulnerability score for each county, while the second approach analyzed common themes discussed by stakeholders. This blending of methods provided a comprehensive picture of drought vulnerability by integrating indicator data with actual, lived experiences of Montanans.
An overview of the resulting vulnerability assessment is below. Each water use sector includes a map depicting the relative level of vulnerability across the state and the main themes discussed by stakeholders.
Primary impacts
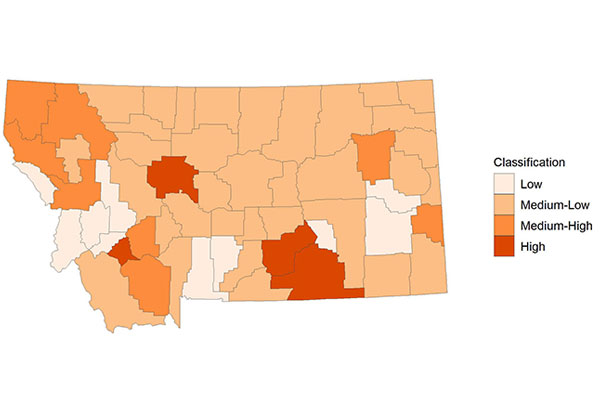
- Revenue losses for fishing outfitters due to low and less-predictable streamflows in summer months.
- Crowding and stress on fisheries because use becomes concentrated in rivers with better flows during drought conditions.
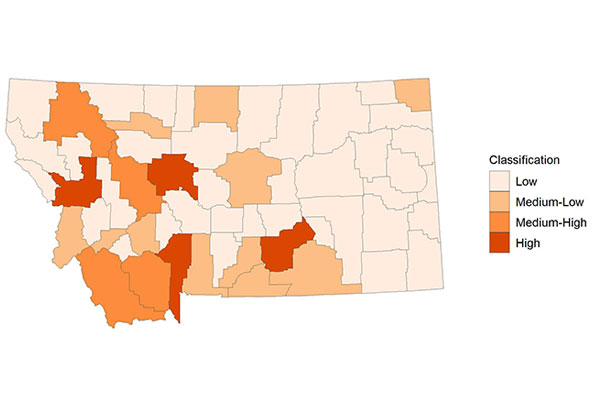
Drought vulnerability for the recreation water use sector - Mental wellbeing of guides and outfitters during persistent, multi-year droughts.
Adaptations
- Outfitters adapt trip schedules and timing to be earlier in the summer and begin early in the day.
- Monitor streamflows and snowpack.
- Support local watershed groups and promote collaboration and cooperation among water users.
- Increase flexibility in water rights system.
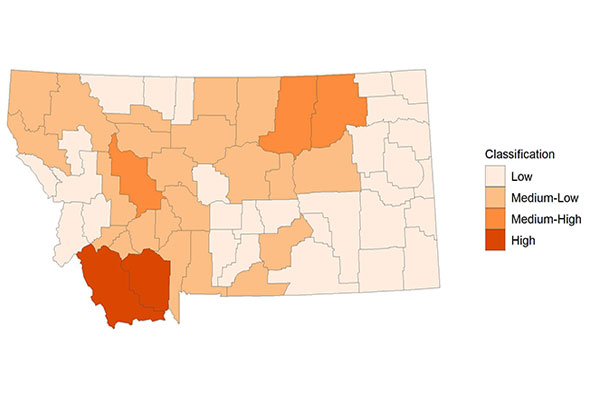
- Production losses from diminished water supply.
- Reduced quality of pastures and crops because of reduced water supply, greater competition from weeds, and grasshopper outbreaks.
- Increased costs to buy and transport hay.
- Additional time and labor needed to
haul water.
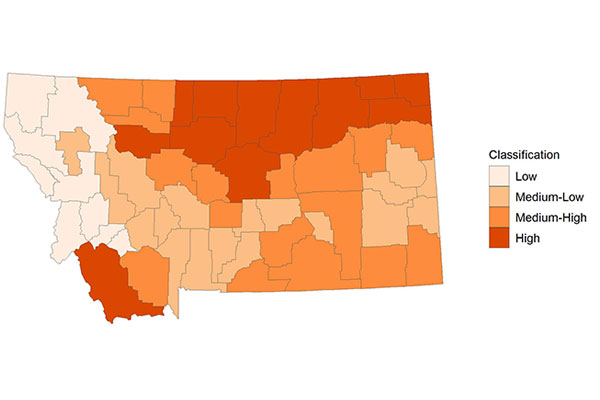
Drought vulnerability for the agriculture water use sector - Greater risk of floods and wildfires.
- Use producer incentives to encourage experimentation and adaptation.
- Broaden support to provide immediate relief and increase financial flexibility.
- Expand network of weather stations for monitoring.
- Create more networking opportunities, like events and workshops, where producers can share successes and failures and learn from one another.
- Offer ongoing support resources for communication, education, and outreach through local organizations, like watershed groups and conservation districts.
Primary impacts
- Challenge of planning for future water demand while preparing for future impacts of drought.
Drought vulnerability for the planning and community development water use sector - Drought is associated with other hazards, like wildfire and flooding, that pose threats to human health, public safety, and community infrastructure.
Adaptations
- Monitor local water supplies, especially groundwater.
- Conduct ongoing community outreach and education.
- Support agricultural producers through drought because rural economies often rely on local agricultural production for their vitality.
- Evaluate strategies for to increase water conservation through incentives or regulations.
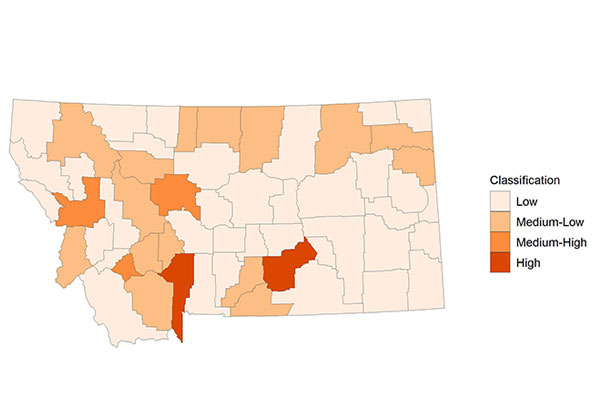
Primary impacts
- Hydropower
- Reduced electricity-generating capacity, especially run-of-river operations with limited storage. Higher volume reservoirs can also be impacted because warmer temperatures associated with drought lead to higher rates of evaporation.
- Complying with licensing requirements, especially flow and temperature, can be more challenging.
- Timber
Drought vulnerability for the energy and industry use sector- Reduced survival rate of planted seedling.
- Impairs forest health by increasing tree susceptibility to pests and disease.
- Wildfire poses direct threat to both the power infrastructure and timber stands. Forest closures or restrictions due to fire risk also limits the amount of outdoor work that can be done.
Adaptations
- Close monitoring of water supply, especially stream gages and SNOTEL.
- Collaborate with other water users and coordinate with state and federal agencies.
- Develop and maintain strong communication networks.
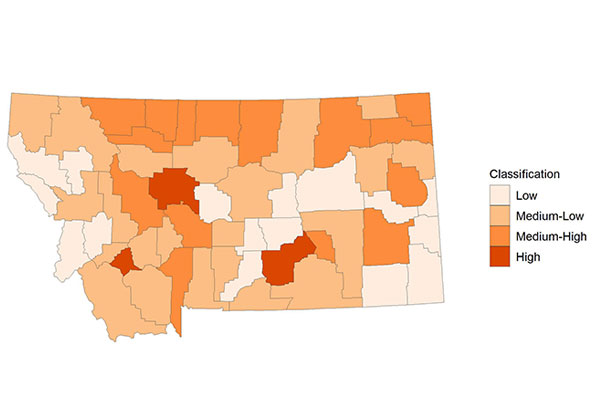
- Low streamflows and shifts in runoff timing.
- Impair water quality because of warmer temperatures, concentration of pollutants, and increased risk of harmful algal blooms.
Drought vulnerability for the Conservation and land management use sector. - Reduce aquatic habitat heterogeneity (less woody debris recruitment and less sediment scouring).
- Trees are more susceptible to insects, diseases, and wildfires.
Adaptations
- Support drought monitoring networks.
- Continue public outreach, education, and communication efforts.
- Manage forests and woody vegetation for drought resilience.
- Increase flexibility in water rights system.
- Seek opportunities to expand water storage.
- Support local watershed groups.
The maps are intended to be a visual tool that allow us to make general comparisons between counties within the same water use sector. Note that the maps are sector specific, so they cannot be used to compare the vulnerability of two different sectors within the same county. Find more data, including how vulnerability changes across seasons, on the full interactive map.
For more information about how vulnerability scores were calculated, as well as deep detail on the stakeholder interviews, can be found in the full Montana Drought Vulnerability Assessment.